How TRADE professionally

ads

ADS 320*100

Sunday, January 17, 2016

10 Most Beautiful but Strange Flowers

10 Most Beautiful but Strange Flowers 


Flowers, with their bright colours and unique shapes, are a wonder of the nature. They make the world a beautiful place. Be it the much known rose or the lesser known orchids, flowers are always mesmerizing. Let us look at some of the most beautiful and strange flowers that adorn the world around us.

10. Bleeding Heart


Bleeding Heart Strange Flowers

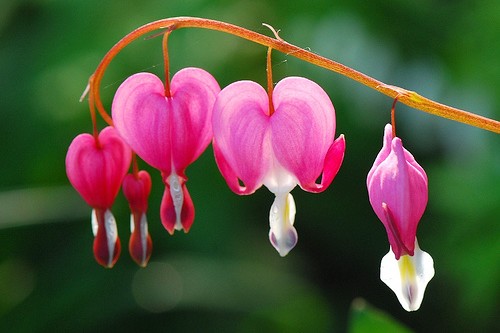
The flower, especially in the bud form, of the Lamprocapnos, a flowering plant of the poppy family, oddly resembles the conventional shape of the heart with e droplet beneath. That is why, it has been given the name, a bleeding heart. The outer petals are bright fuchsia in colour. As the flower blooms further and the outer petals open up, the inner, white parts, often called the ‘lady in a bath’ become more visible. This plant is found in Siberia, northern China, Korea and Japan.

9. Parrot Flower


Parrot Flower

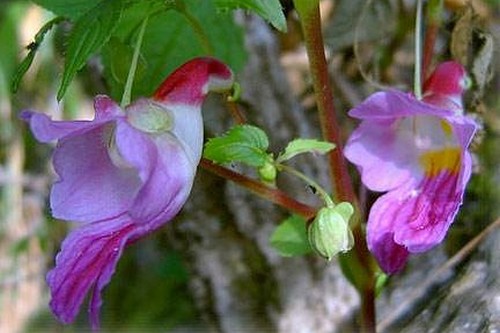
The Impatiens Psittacina is an amazing plant of the balsam family. The flowers are purple and carmine red in colour. When viewed from the sides, the flowers seemingly resemble a parrot in flight. British botanist and explorer, Sir Joseph Dalton Hooker, first noted, in a scientific description of the plant in 1901, how its bloom looks like a ‘flying cockatoo’ and from then on, the name has stuck. This rare plant is found in Thailand, Burma and parts of India.

8. Ballerina Orchid


Ballerina Orchid Strange Flowers

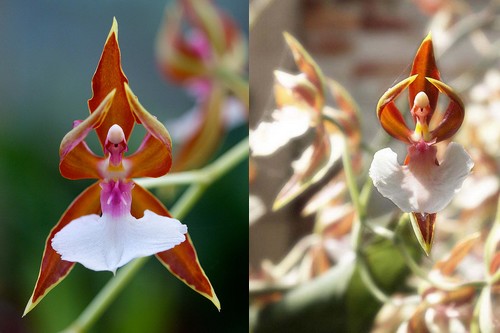
These small plants are terrestrial spider orchids that grow singly or in groups in different parts across the island of Australia. The flowers are essentially cream in colour, with maroon markings, and their petals and sepals have dark trichromes. Together, the flower looks like a maiden in white tutus, holding a graceful ballet pose. The grazing of rabbits and kangaroos in the regions where they grow pose great threat to these orchids.

7. Duck Orchid


Flying Duck Orchid

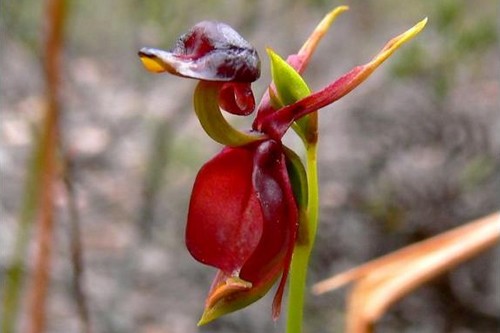
Caleana is commonly referred to as the Duck Orchid. This is because, the labellum looks just like a flying duck with its wings raised high. The lip, in particular, looks clearly like the beak of a duck. The flower is reddish brown in colour, and in rare cases, it is greenish with dark spots, and a single leaf appears near the base of the stalk. This small terrestrial orchid is found in the Australia, from Queensland to South Australia, and even Tasmania.

6. Snapdragon and its Skull


Snapdragon and its Skull

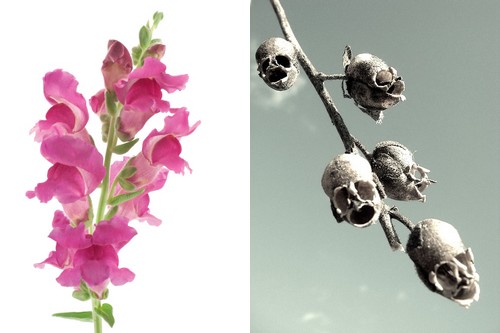
The Antirrhinum, found in the rocky areas Europe, America and North Africa, has an interesting flower called the dragon flower or snapdragon. The beautiful flower petals give the impression of the face of a dragon, which, when squeezed, will open and close like the mouth. But, once the petals wither and fall off, only the seed pod is left behind, presenting quite a macabre look, because the seed pod looks like a skull. Ancient cultures believed snapdragons to have supernatural powers.

5. Dove Orchid/Holy Ghost Orchid


Strange Flowers Holy Ghost Orchid

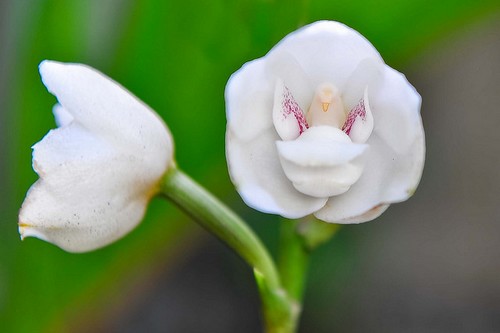
Peristeria is an orchid that is commonly found to grow across much of South America, along with Panama, Trinidad and Costa Rica. One look inside the pure white flower reveals a structure hidden inside it, which looks like dove. In fact, sitting cosy in the centre within the petals is an entire dove, complete with raised wings with tiny pink dots, and a tiny yellow beak. This structure is the reason behind its name. It is indeed one very peaceful looking flower.

4. Naked Man Orchid


Strange Flowers Naked Man Orchid

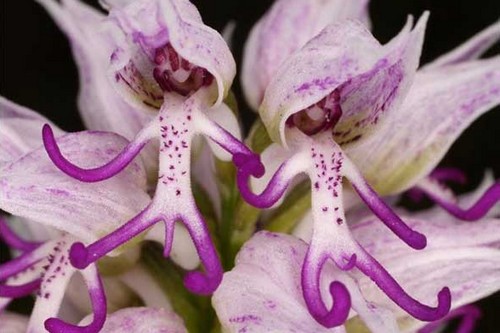
The Orchis italica is often referred to as the Italian orchid, owing to its Mediterranean region where it generally grows in large numbers. But, more commonly, it is known as the naked man orchid. This is because, the amazing flowers of the orchid have petals that look like naked men. The flowers are a combination of bright pink and white in colour, and they are all clustered densely. These strangely shaped flowers make the plant quite popular.

3. Monkey Orchid


Strange Flowers Monkey Orchid

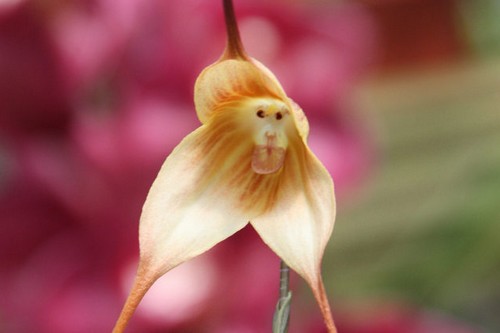
The Dracula Simia or the Monkey Orchid is also known as the monkey-like Dracula. This is a rare species of orchids which is found to grow in the cloud forests of south-eastern parts of Ecuador and Peru. The orchid is called so because it has flowers which display an odd arrangement of column, petals and lip that strongly resembles the face of a monkey – a baboon, to be more specific. The flowers bear the fragrance of a ripe orange.

2. Hooker’s Lips


Hookers Lips Psychotria Elata

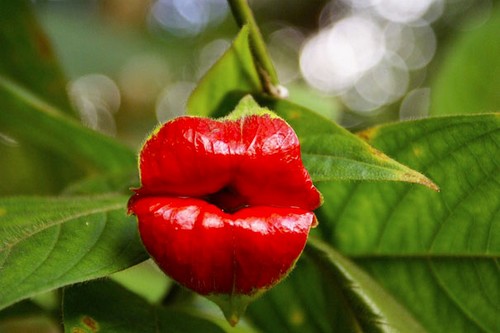
While many might consider it an exaggerated description, the Psychotria Elata, also called the Hooker’s Lips or Kissing Lips plant, is absolutely genuine. It exists in the tropical rainforests of Central and Southern Africa. The waxy bract, which is a modified or specialized leaf, associated with the flower, is bright red in colour, and is shaped like the luscious lips of a woman, complete with a well-defined cupid’s bow. The actual star-shaped flowers emerge from the bract’s centre.

1. Swaddled Babies


Swaddled Babies Strange Flowers

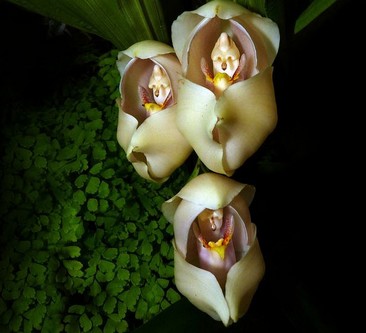
The Angloua Uniflora is a beautiful orchid which is commonly known by the name, Swaddled Babies. The plant grows in the Columbian Andes. The most stunning feature of the plant is its flowers which are large, creamy-white and waxy. Their structure is quite complex, and at a certain stage of opening, they start to look like a baby wrapped in swaddling cloth. Each flower blooms from a single stem from the base of the pseudobulbs.

There are many more such plants with oddly shaped. Some look like Dancing Girls, while others look like Laughing Bumble Bees. Some flowers bear resemblance to smiling (and probably loopy) Happy Aliens, while another may look freakishly like the Darth Vader. All in all, Mother Nature has shown some remarkable creativity with her beautiful and strange flowers.

???? ??????

Wednesday, December 23, 2015

DBC: PowerShares DB Commodity Tracking ETF


DBC: PowerShares DB Commodity Tracking ETF


Commodity exchange-traded funds (ETFs) invest in commodities by purchasing futures contracts or holding physical commodities in storage. Several commodity ETFs offer exposure to a single commodity or to various commodities. The PowerShares DB Commodity Tracking ETF (NYSEARCA: DBC) tracks an index that includes 14 of the most heavily traded liquid and import physical commodities.

What It Tracks

DBC seeks to track fluctuations in the level of the DBIQ Optimum Yield Diversified Commodity Index Excess Return, the fund's benchmark index, plus the interest income earned from DBC's holdings of U.S. Treasury securities, before fees and expenses. DBC's benchmark index tracks 14 commodities included in the agriculture, energy, industrial metals and precious metals sectors. The benchmark index includes gasoline, heating oil, Brent crude oil, WTI crude oil, gold, wheat, corn, soybeans, sugar, natural gas, zinc, copper, aluminum and silver.
By design, the benchmark index selects its securities based on the futures curve, and it is intended to minimize the effects of contango and maximize the effects of backwardation. Contango occurs when the price of a futures contract is greater than the commodity spot price, while backwardation occurs when the opposite is true.

How It Tracks It

DBC seeks to achieve its investment objective by investing in a portfolio of futures contracts on the commodities comprising the benchmark index. As of June 30, 2015, DBC allocates 12.02% of its portfolio to RBOB gasoline futures, 11.34% to heating oil futures, 11.11% to Brent crude oil futures, 9.65% to WTI crude oil futures, 9.61% to gold futures, 7.55% to wheat futures, 6.97% to corn futures, 6.88% to soybean futures, 4.98% to sugar futures, 4.73% to natural gas futures, 4.36% to zinc futures, 4.33% to copper futures, 4.11% to aluminum futures and 2.35% to silver futures.
Futures contracts on these commodities are contractual agreements that allow investors to buy or sell a particular commodity at a predetermined price on a future date. Some of these commodity futures contracts may be settled in cash or called for physical delivery.
DBC implements a rule-based strategy when it rolls its futures contracts – when it sells the nearer dated futures and purchases further dated contracts. Unlike many commodity ETFs, DBC does not purchase its commodities futures contracts based on a predetermined schedule. Rather, DBC rolls its futures contracts based on the shape of the futures curve, which helps to generate the best potential implied roll yield. As a result of DBC's rule-based approach, it can potentially maximize the roll benefits during backwardation markets and potentially minimize the losses from rolling its futures contracts in contango markets. The fund's high expense ratio, illiquidity of underlying futures contracts and the transaction fees incurred when rolling futures contracts contribute to the its moderately high tracking error of 0.3%.

Management

DBC was issued by Invesco PowerShares and is a part of Invesco's PowerShares Alternative - Commodities ETF series. This series offers ETFs that track single commodities, such as gold, silver and oil, as well as ETFs that track multiple commodities within one or more sectors. These commodity ETFs were developed by Deutsche Bank and provide investors with options to gain exposure to the commodity market.
Invesco PowerShares Capital Management is an investment management company and has been a subsidiary company of Invesco since 2006. Invesco PowerShares offers approximately 140 U.S. and non-U.S. ETFs and has $792.4 billion in assets under management. Invesco offers investors nearly 70 years of investment management experience and provides many options to suit investors' objectives.

Characteristics

DBC is legally structured as an open-ended fund, and it rebalances and reconstitutes its portfolio annually in November. Since DBC uses a specialized rolling strategy and tracks multiple commodities, it charges an expense ratio of 0.85%, which is in line with the average expense ratio of commodities broad basket funds. As of June 30, 2015, DBC has a weighted average market cap of $2.5 billion. DBC is considered a smart beta fund, which seeks to reduce the overall portfolio risk using Deutsche Bank's Optimum Yield strategy.

Suitability and Recommendations

Since commodities are globally consumed, it is difficult to determine future price movements, as well as supply and demand levels. The speculative nature of DBC's underlying holdings means that the fund is not suitable for all investors due to the high degree of potential volatility. Based on trailing five-year data, as of July 31, 2015, DBC has a standard deviation of 17.5%, while major market indexes, such as the S&;P 500 TR Index, experienced a lower degree of volatility. The degree of risk in investing in DBC is shown in its modern portfolio theory (MPT) statistics.
Based on trailing five-year MPT statistics, DBC's alpha (against the standard index, the Morningstar Long-Only Commodity TR Index) indicates the fund underperformed the standard index by 3.01% on a risk-adjusted basis. DBC's Treynor ratio (against the standard index) indicates it lost 7.44% per unit of risk on a risk-adjusted basis, which is not favorable to investors seeking to outperform the overall market.
In terms of MPT, DBC is best-suited for long-term value investors with high risk tolerances who seek exposure to the commodities market, and who believe commodities are undervalued at their current price levels. DBC is also suitable for investors seeking to stave off inflationary risks that can impact their overall portfolio. During times of inflation, commodities can serve as a hedge due to their negative correlation to bonds and equities.

How Financial Adviser Clients Could Use This ETF

Financial advisers can use DBC to add value to their clients' equity and bond portfolios by hedging inflation. DBC allows investors to place a tactical trade on unexpected inflation increases, since it has a low to negative correlation to other asset classes. If investors believe the U.S. Treasury is continuously printing money without reason, which causes inflation to increase, DBC can add value by providing diversified exposure to various commodities.
However, financial advisers should inform clients about the fund's high expense ratio and tracking error, which can be expensive for some investors to hold for long periods of time. Similarly, since the fund invests in futures contracts, financial advisers should indicate that investors may lose a substantial amount of their investments due to the speculative nature of these derivative contracts.

Main Competitors and Alternatives

The iPath Bloomberg Commodity Index Total Return ETN is an alternative and competitor to DBC. The exchange-traded note (ETN) tracks a broad index of front-month commodities futures contracts. It offers an expense ratio of 0.75% and provides exposure to 10 commodities in various sectors.
The GreenHaven Continuous Commodity ETF is another competitor and alternative to DBC, providing exposure to 17 commodities included in an equal-weighted index. The ETF seeks to minimize the effects of contango by investing in futures contracts across the nearest six months of the futures curve. The fund rebalances its portfolio daily to main equal weights across all commodities.
Unlike DBC, the First Trust Global Tactical Commodity Strategy Fund is an actively managed ETF with an expense ratio of 0.95%. This ETF provides exposure to commodities through its holdings in its subsidiary company. The fund takes a risk-managed approach to commodities investing and seeks to provide investors with higher risk-reward ratios. The First Trust Global Tactical Commodity Strategy Fund provides exposure to 10 to 35 distinct commodities based on their liquidity and implements an investment approach that seeks to maximize returns based on the level of volatility in the commodities.

???? ??????

XLG: Guggenheim Russell Top 50 Mega Cap ETF


XLG: Guggenheim Russell Top 50 Mega Cap ETF 


The Guggenheim Russell Top 50 Mega Cap ETF (NYSEARCA: XLG) is an exchange-traded fund (ETF) designed to provide investors with exposure to the 50 largest U.S. companies. Since XLG's inception on May 4, 2005, the fund has an annualized market return of 6.76% as of Aug. 6 2015. These past returns do not indicate that XLG will provide the same returns in the future.
XLG has a diversified portfolio, allocating its portfolio to multiple sectors, such as 25.95% in technology, 19.47% in health care, 15.87% in financial services, 10.94% in consumer staples, 10.19% in consumer discretionary, 6.75% in energy, 6.2% in product durables, 4.53% in utilities and 0.1% allocated to other sectors.
XLG tracks the daily price movements and provides exposure to 50 of the largest U.S. companies, by market capitalization, by holding common stock of the component companies of the Russell Top 50 Mega Cap Index. For example, as of Aug. 6, 2015, the fund top 10 holdings are 7.55% Apple Incorporated, 4.29% Microsoft Corporation, 3.72% Exxon Mobil Corporation, 3.13% Johnson &; Johnson, 3.05% Wells Fargo &; Company, 2.99% Berkshire Hathaway Incorporated Class B, 2.99% General Electric Company, 2.88% JP Morgan Chase &; Company, 2.47% Pfizer Incorporated and 2.37% AT&;T Incorporated. These holdings are subject to change and may not reflect the fund's future holdings and sector allocations.

Characteristics

The Guggenheim Russell Top 50 Mega Cap ETF is listed on the New York Stock Exchange Arca, and investors can trade the ETF on multiple platforms on the secondary market. The investment adviser of the fund is Security Investors LLC, and the distributor is Guggenheim Fund Distributors LLC.
The fund maintains a low turnover ratio of 6%, which may indicate the fund implements a passive management strategy that keeps the expense ratio low. Given the average expense ratio of the XLG category of large blend is 0.34%, the fund has a competitive expense ratio of 0.2%. The expense does not include broker and trading fees.

Suitability and Recommendations

Since XLG tracks the prices of U.S. mega-cap companies, investors should pay attention to the risks associated with the ETF. These risks include equity risk, market risk, economic risk and interest rate risk. Similarly, investors should follow news stories related to the fund's top weighted holdings, which can affect the prices of the ETF.
As of July 31, 2015, based on trailing five-year data, XLG had an alpha (against the S&;P 500 Total Return USD Index) of 0.05, a beta (against the S&;P 500 Total Return USD Index) of 0.94, an R-squared of 95, a Sharpe ratio of 1.31 and a Treynor ratio of 16.18.
Based on modern portfolio theory (MPT), the fund's alpha indicates it outperformed the S&;P 500 TR USD Index by an annualized 0.05%. XLG's beta indicates it is theoretically less volatile than the S&;P 500 TR USD Index; this may indicate XLG carries less risk than the index. XLG's R-squared indicates that 95% of its past fluctuations can be explained by fluctuations in the S&;P 500 TR USD Index. XLG's Sharpe ratio indicates the fund has been providing investors with favorable returns on a risk-adjusted basis. Similarly, the fund's Treynor ratio indicates that it generated an annualized 16.18% per unit of risk. These past statistics may not be indicative of the fund's future performance.
The fund is not suitable for all participants in the stock market. Its scanty average daily share volume, which may be too illiquid, may not suitable for traders and speculators. XLG is a low-risk, high-reward investment suitable for investors who seek exposure to U.S. mega-cap companies and do not want to hold portfolios of companies with which they are unacquainted. The fund is best-suited for investors who seek overweight exposure to mega-cap stocks while maintaining below-average risk.

???? ??????

VV: Vanguard Large-Cap ETF


VV: Vanguard Large-Cap ETF 


Vanguard Large-Cap ETF (VV) was established in January 2004 and has tracked a target index comprised of large-cap growth and large-cap value stocks to provide investors a 10-year annualized return of 8.18%. Currently, VV uses the CRSP U.S. Large Cap Index as its target index for performance, which lists a diversified group of U.S. common stock for companies that fall within the top 85% of market capitalization in the country.
Large-cap stocks are a well-known staple in traditional asset allocation models. While exchange-traded funds (ETFs) with 100% equity holdings bear more risk than a fund with diversification across different asset classes (money markets or bonds), large-cap stocks are less volatile than small- or mid-cap common stocks. The largest companies operating within the United States are known to pay out steady dividends to shareholders and can often weather downturns in the market with greater ease compared to smaller companies. The Vanguard Large-Cap ETF is comprised of 649 large-cap companies, including tech giants such as Apple, Exxon Mobil Corporation and Johnson & Johnson.
Utilizing a standard indexing management approach, VV invests nearly all fund assets into the securities listed on the target index in a passive management style. Currently, the CSRP U.S. Large Cap Index is weighted most heavily in the financial sector (17.9%), followed by technology companies (16.9%), health care organizations (14.2%) and consumer services (13.9%). However, the index also includes industrial companies, oil and gas, consumer goods and basic materials.

Characteristics

The Vanguard Large-Cap ETF is categorized as a full-replication, passively managed open-ended investment company, managed by tenured professionals within the Vanguard Group, Inc. VV seeks to mimic the performance of its target index by replicating holdings in similar proportions. This strategy keeps the fund predictable as well as cost efficient for investors seeking exposure to the large-cap domestic market.

As Vanguard is widely known for investor-friendly expense ratios due to an overarching simplistic investment style, it is no surprise that VV has an exceptionally low expense ratio of 0.09%. As with other ETFs offered through the Vanguard Group, investors can buy or sell VV on the secondary market, which may or may not include broker fees and commissions.

Suitability and Recommendations

Similar to other all-equity pooled investment options, VV comes with a degree of risk. Because the ETF focuses its holdings on the common stock of large-cap companies within the United States only, investors gain exposure to a relatively concentrated group of securities. However, VV diversifies fund assets across both large-cap growth and large-cap value stocks, creating a blended ETF in the large-cap space. The combination of both growth and value shares reduces some risk for investors as each provides a slightly different path toward capital appreciation. Overall, VV is best suited for investors with longer time horizons for their investments.
When compared to similar large-cap ETFs, VV is relatively low on the scale of risk. This can be attributed to the fund managers' passive approach to investing, as well as the fund's impressively low management fees.
For those who follow modern portfolio theory (MPT), certain risk-related statistics can be analyzed to further determine suitability of an investment. Over the last three years, VV has had an alpha of 0.18 against its target index, an R-squared value of 99.75 and a beta of 1. Additionally, VV has had a standard deviation of 8.53 and a Sharpe ratio of 1.93.
While it is clear that VV carries with it some risk for investors, it may be appropriate for individuals seeking long-term capital appreciation from an investment. VV has a strong history of performance in line with its target index, and it allows investors an opportunity to gain exposure to a blended large-cap portfolio with minimal cost.

???? ??????

EWU: iShares MSCI United Kingdom ETF


EWU: iShares MSCI United Kingdom ETF


The iShares MSCI United Kingdom fund (NYSEARCA: EWU) is an exchange-traded fund, or ETF, that provides investors access to a select equities market by tracking the total performance return of the MSCI United Kingdom Index as its target benchmark. The MSCI United Kingdom Index is composed of 111 large- and mid-cap company stock holdings that together represent nearly 85% of the total free float-adjusted market capitalization of the United Kingdom. The Index utilizes the same standards and methodology of MSCI Global Investable Market Indexes which attempt to cover a wide range of regional, market capitalization, sector and style segments of the international equity markets. EWU follows the same standards as its benchmark index. As of August 2015, EWU has provided investors an annualized total return of 5.9% since the fund's inception in 1996.

How It Tracks It

EWU fund managers utilize a replication approach to effectively track the total performance return of the fund's benchmark index. Each equity position held within the ETF follows the same screening guidelines as the benchmark, and the majority of the fund's 111 holdings have the same weighting as the underlying index. Fund managers are required to invest a minimum of 90% of fund assets in securities or depository receipts of securities found within the benchmark, while the remaining 10% may be used for specific futures, swap and options contracts, or cash and cash equivalents at the fund manager's discretion. As of August 2015, performance of EWU lags the benchmark index by a 12-month median tracking difference of 0.49%, which is nearly equivalent to the ETF's gross expense ratio.
While EWU has a narrow focus in terms of geographic location and market capitalization, the fund diversifies investor assets over a broad range of business sectors. The heaviest sector weighting within the ETF is the financials sector with exposure of 23.27%. The consumers staples sector makes up 17.11% of fund assets, followed by the energy sector at 13.3%, the consumer discretionary sector at 10.57%, the health care sector at 9.65% and the industrials sector at 6.9%. In addition, EWU provides investors access to the materials, telecommunications, utilities and information technology sectors, each with less than a 6.5% exposure.
EWU's top holdings include HSBC Holdings PLC at 6.21%, Royal Dutch Shell PLC at 4.09%, BP PLC at 4.07%, British American Tobacco PLC at 4.03% and GlaxoSmithKline PLC at 4.02%.

Management

The iShares MSCI United Kingdom ETF is professionally managed by and made available to investors through the brand's parent company, BlackRock, Inc. As a leading provider of efficient, low-cost ETFs, iShares, with the support of BlackRock, manages more than $1 trillion investor assets and offers more than 700 ETFs that span domestic and international equities, bonds and money market investments. Within the iShares family of ETFs, EWU represents one of 38 single-country ETFs and one of three funds focused solely on the U.K.

Characteristics

EWU fund managers implement a passive management investment approach when allocating investor assets within the ETF. The purpose of passive management is to simply track the performance of an underlying index or benchmark, as opposed to outperform the overall market as is the case with actively managed investments. Because EWU is passively managed, the fund's gross expense ratio of 0.48% is considered low by industry standards. While EWU's expense ratio is slightly lower than the average expense ratio of 0.60% for all ETFs, it is higher than the category average expense ratio of 0.47%.

EWU is available for trading through the New York Stock Exchange Arca, the prominent exchange for all ETFs and other select exchange-listed securities. While the expense ratio for EWU represents a low cost of ownership for investors, trading fees, commissions and other transaction expenses may affect the total cost for buying and selling the fund. Each of these fees vary depending on the extent to which advisor or broker assistance is required and the trading platform used to execute a buy or sell order for the fund.

Suitability and Recommendations

Investment in EWU is appropriate for investors seeking exposure to large- and mid-cap companies operating within the U.K. Large market capitalization speaks to a company's long-standing reputation and ability to weather economic downturns better than smaller organizations. Additionally, the financial stability of large- and mid-cap companies often leads to steady dividend payouts over time, which can enhance the overall return within an investor's account. While growth is not typically the focus in large- or mid-cap international ETFs such as EWU, there is potential for an increase in stock price and company valuations over an extended period of time.
While EWU presents a unique opportunity to investors looking for specific exposure to the U.K. equity market, the fund carries with it some degree of risk. Large- and mid-cap companies located outside the domestic landscape face the risks inherent to international business operations, including political risk, natural disasters and currency risk. In addition to these threats to growth and stability of price, EWU's geographic focus is narrow, making it more susceptible to shifts in the equity markets of the U.K. when compared to a more diversified fund.
The risk metrics of beta and standard deviation clearly speak to the potential for volatility in performance of EWU and its underlying benchmark index. EWU has a five-year trailing beta of 0.96, meaning the fund it less likely to move in line with the domestic market. Additionally, EWU's five-year standard deviation is 15.54%, which points to the fund's overall volatility based on unpredictable returns spread over a large range. Due to these risk factors, EWU is best-suited for investors with a high tolerance for risk and a willingness to invest for a long-term.

How Financial Adviser Clients Could Use This ETF

A financial adviser can use EWU as a small holding within the international equity asset allocation subset of an otherwise diversified client account. Because EWU holds large- and mid-cap international stocks, financial adviser clients may utilize the ETF as a hedge against other international or domestic holdings not directly correlated with the market movement of the U.K. EWU also has the potential to pay steady dividends to investors, which can help pad investment returns over time. Due to the fund's risk profile and narrow focus, however, financial advisers should limit a client's exposure by refraining from using EWU as a single international holding. Instead, EWU should be positioned among other global equities and bonds, as well as a strategic mix of domestic equity and bond holdings.

Main Competitors and Alternatives

Regionally focused ETFs are common among large fund distributors, which creates competition for EWU. Alternatives to EWU include the First Trust United Kingdom AlphaDEX ETF, which tracks the performance of the Nasdaq AlphaDEX United Kingdom Index, and the SPDR MSCI United Kingdom Quality Mix ETF, which tracks the performance of the MSCI UK Quality Mix A-Series Index.
The First Trust United Kingdom AlphaDEX ETF includes 75 holdings and has an expense ratio of 0.8%, while the SPDR MSCI United Kingdom Quality Mix ETF includes 110 holdings and has an expense ratio of 0.3%.


???? ??????

EUFN: iShares MSCI Europe Financials ETF


EUFN: iShares MSCI Europe Financials ETF


The iShares MSCI Europe Financials (NYSEARCA: EUFN) exchange-traded fund (ETF) was created in 2010 to track the performance of the MSCI Europe Financials Index, which is composed of financial companies of developed market countries in Europe. Since the fund's creation, EUFN has demonstrated an average annual return of 2.17%.
The financial sector in Europe has been hit hard as a result of the financial crisis in 2008. Many central banks resorted to accommodating monetary policies. The European Central Bank (ECB) cut the benchmark interest rate several times from 2010 to 2015 and initiated an asset purchase program in 2015. As a result of these actions, net interest margins for European banks shrunk substantially. However, as the pace of economic activity in Europe begins to pick up, European financial institutions are expected to regain ground and show an increase in profits. EUFN presents an appealing opportunity for investors to profit from the rebound in the European financials sector.
EUFN invests in equities of financial institutions with a wide geographic dispersion. The fund has concentrated holdings of U.K. financial companies with 31% allocation, while Switzerland has the second-largest allocation at 12%. The fund also invests in other developed European countries, such as Germany with 11% allocation, Spain with 10% and Italy with 7% allocation.
EUFN invests predominantly into European banks that account for the 52% of the fund's holdings. Other industries, such as insurance and diversified financials, account for 26 and 15%, respectively. Real estate companies have about 6% allocation. The top five holdings of EUFN account for 25% of the fund's invested assets and are HSBC Holdings PLC, Banco Santander SA, UBS Group Registered AG, Allianz SE and Lloyds Banking Group PLC. No single company has more than 9% allocation, and the fund's top 10 holdings have 41% allocation.

Characteristics

EUFN was created on Jan. 20, 2010, and it is managed by BlackRock Fund Advisors. The fund employs a passive investment strategy by using representative sampling. While EUFN rebalances its portfolio from time to time to make it more similar to the underlying index, the fund does not sell or buy stocks to take advantage of market swings. The fund has an expense ratio of 0.48%, which is in line with its peers.
EUFN is traded on the New York Stock Exchange Arca, and investors can purchase the fund's shares through investment brokers.

Suitability and Recommendations

Regulation and compliance costs for the financials sector increased dramatically since the financial crisis of 2008, leading to plummeting profitability for European financial institutions. European banks are required by the ECB set aside more capital to cushion against negative shocks and to perform annual stress tests. Also, the litigation costs for European financial institutions increased dramatically as a result of numerous wrongdoings committed by banks. Investors should be well-aware of current regulatory development for the European financial sector before investing in EUFN.
Many major Western European countries are expected to show robust growth due to lower petroleum costs, the depreciation of the euro and the ECB's expansionary monetary policy. Also, as Greece is likely to stay in the eurozone, the fears of financial contagion subsided, leading to more stable economic environment within Europe. These positive developments should benefit the expected returns of EUFN.
According to modern portfolio theory (MPT), EUFN is most suitable for a growth investment strategy due to the European financials sector benefiting from the economic rebound in Europe.
As of August 2015, EUFN demonstrated a lot of volatility and below-average returns over the last five years. The five-year standard deviation was 23.6%, while the average annual return was 4.4%, resulting in the five-year Sharpe ratio of 0.3, which is significantly lower than the Sharpe ratio of 1.34 for the S&P 500 Index. This is primarily attributed to increased compliance and litigation costs for the European financial institutions.
EUFN is most appropriate for investors interested in gaining exposure to the European financials sector with a high degree of diversification across numerous industries within the sector. Due to its exposure to a single sector and foreign markets, investors should include EUFN as part of the broadly diversified portfolio.

???? ??????

UGA: United States Gasoline Fund ETF


UGA: United States Gasoline Fund ETF


The United States Gasoline Fund (NYSEARCA: UGA) is an exchange-traded fund (ETF) tracks the daily percentage fluctuations in the price of gasoline, also known as reformulated gasoline blend stock for oxygen blending. The fund provides investors, traders and speculators an opportunity to gain exposure to RBOB gasoline.
The fund's benchmark is the RBOB Gasoline PR USD, which is measured by the daily fluctuations in the price of the futures contracts on RBOB gasoline for delivery to the New York harbor, traded on the New York Mercantile Exchange. If the near month contract is within two weeks of its expiration date, the benchmark is the RBOB gasoline futures contract expiring the next month.
UGA tracks the daily price movements and provides exposure to RBOB by holding primarily front-month futures contracts on RBOB and other gasoline-related futures contracts, and it may invest in forwards and swap contracts. For example, as of Aug. 3, 2015, the fund holds 1,182 NYMEX RBOB Gasoline futures contracts that expire in September 2015 at $1.6745, and the total market value of this holding is $83.13 million. The fund also holds various U.S. Treasury securities, as well as cash in U.S. dollars.

Characteristics

The United States Gasoline Fund is listed on the New York Stock Exchange Arca, and investors, traders and speculators can trade the ETF on multiple platforms. Like other United States Commodity Funds, UGA's administrator is Brown Brothers Harriman &; Company, its general partner is the United States Commodity Funds LLC, and its distributor is ALPS Distributors Inc.
UGA must change the composition of its holdings as the futures contracts approach the expiration date. Consequently, UGA rolls its contracts by selling the RBOB gasoline futures contracts expiring in the near month and buying RBOB gasoline futures contracts expiring the next month. Since the fund does not select its futures contracts based on the futures curve, UGA sensitive to the shape of the natural gas futures curves. If the RBOB gasoline futures are in contango, it can cause a negative roll yield, which may lead to losses.
Given the average expense ratio of the UGA category of commodities energy is 0.57%, the fund has a moderately high expense ratio of 0.75%. This can be attributed to monthly rolling of futures contracts. This expense ratio does not include broker fees.

Suitability and Recommendations

Investors should pay attention to the futures prices of RBOB gasoline, EIA Petroleum Status reports, EIA Short-Term Energy Outlook reports, EIA U.S. Weekly Supply Estimates, and geopolitical and weather-related news. Investors should pay particularly close attention to the weekly fluctuations in the supply of RBOB gasoline. The supply of RBOB gasoline affects the prices of the futures contracts on the commodity, as well as UGA.
As of June 29, 2015, based on trailing three-year data, UGA had an alpha (against the MSCI ACWI NR USD Index) of 10.82; a beta (against the MSCI ACWI NR USD Index) of 1.65, an R-squared value of 75.78 and a Sharpe ratio of -0.05. Based on modern portfolio theory (MPT), UGA's alpha indicates it outperformed the MSCI ACWI NR USD Index by an annualized 10.82%. The fund's beta indicates that it is theoretically 65% more volatile than the MSCI ACWI NR USD Index; this may indicate UGA carries more risk. UGA's Sharpe ratio indicates the fund has not been providing investors with an adequate return given the amount of risk taken. UGA's R-squared value indicates that 75.78% of its past fluctuations were explained by fluctuations in the MSCI ACWI NR USD Index.
Although UGA carries a high level of risk, it has the potential to provide high returns. UGA is not suitable for all investors due to its specialized exposure to RBOB gasoline. According to modern portfolio theory, UGA is suitable for short-, intermediate- and long-term value investors who believe RBOB gasoline prices are poised to rebound in the intermediate term or the long term. Investors who have a value investing approach and believe the supply in RBOB gasoline will decrease, causing the prices of gasoline to increase, can use UGA as an investment vehicle. Due to UGA's low average share volume, it may not be suitable for active day traders.

???? ??????